
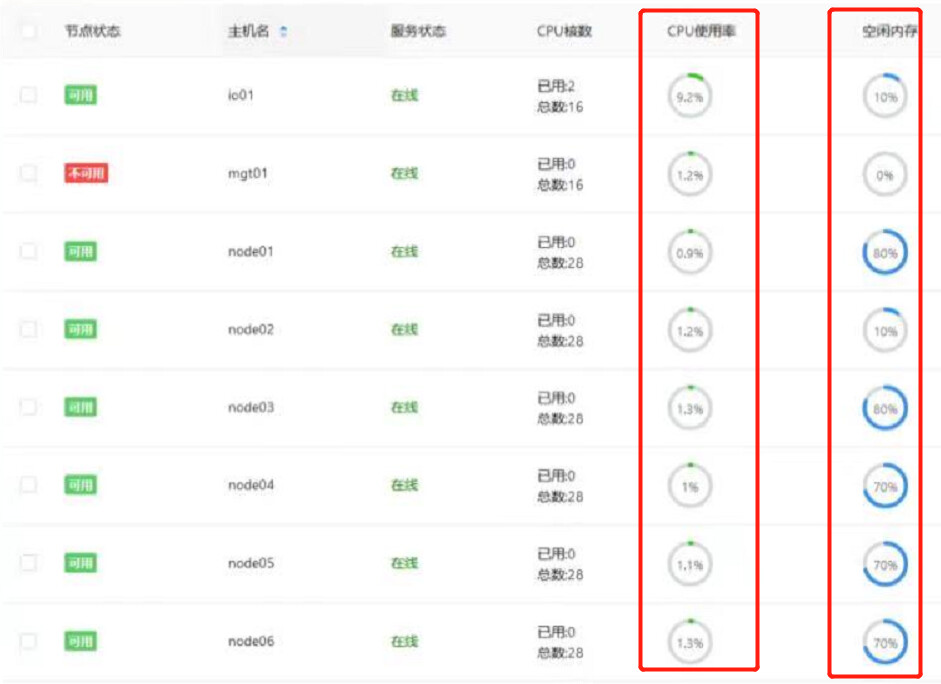
I want to use a dount chart in the datatable, just like the following figure. I checked the documents and forums, but I couldn’t find a solution to the problem.
Hello, @Herion!
Unfortunately, there is no opportunity to embed view ( Donut Chart, or any other view) straight to the datatable cell.
You can try to use sparklines instead(small graphs embedded into the datatable and used for presenting the general variation of certain parameters).
Also in the Webix Pro edition there is a possibility to add Subviews.
Here is a snippet: Code Snippet