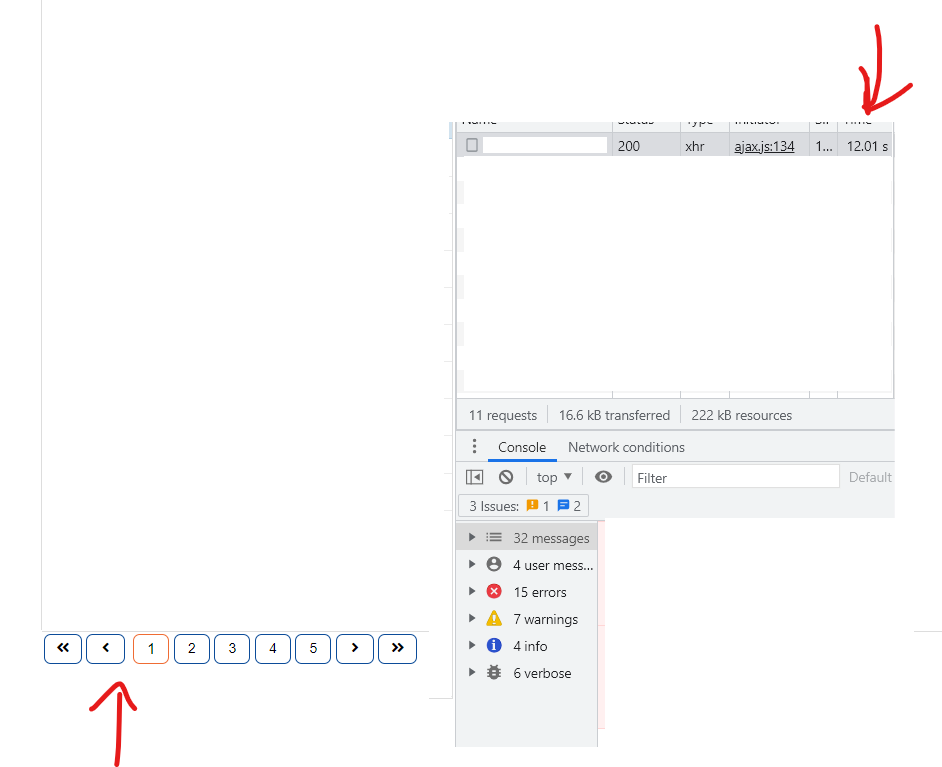
As you can see in my picture. The record takes 12 seconds to get data from the server but it takes about 18 seconds to display the data on the “datatable”.
Hello,
As you correctly noted, the reason for the lower performance is in adjust: true.
I will duplicate here the answer that I have left in the documentation on a similar question.
“adjustColumn” or just “adjust” uses the entire dataset to calculate the column’s width by default and therefore it can impact the time of performance.
At the moment, one of the following solutions may suit you:
Using adjustBatchattribute of columns. It limits the number of rows that will be used in the calculation of the maximum column width. So, you can define adjustBatch: 50 and the size will be calculated based only on these 50 items, not all the rows, which can make the process faster. However, notice that in this case the sizes will take into account only the first 50 records of the entire table.
Example: Code Snippet
You can adjusts the columns to the width of their headers, not the all data items. Doing so the column will be adjusted only to its header instead of going through all datatable items to calculate the width and it is, naturally, faster.
Example: Code Snippet
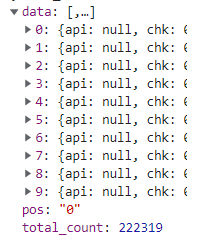
Also, as for total_count, the speed of loading is not related to this parameter. A request is sent to the server only for the number of records specified in the datafetch (50 records by default). Total_count is returned in the server response and is needed to correctly calculate the component height or the number of pages in the pager. At the same time, the whole data is not rendered. Only visible records in the table are rendered (lazy rendering), which does not affect the datatable rendering.
As an example, there is a datatable with total_count: 2,000,000 https://snippet.webix.com/1vru38lw